
Appearance
The Report Designer
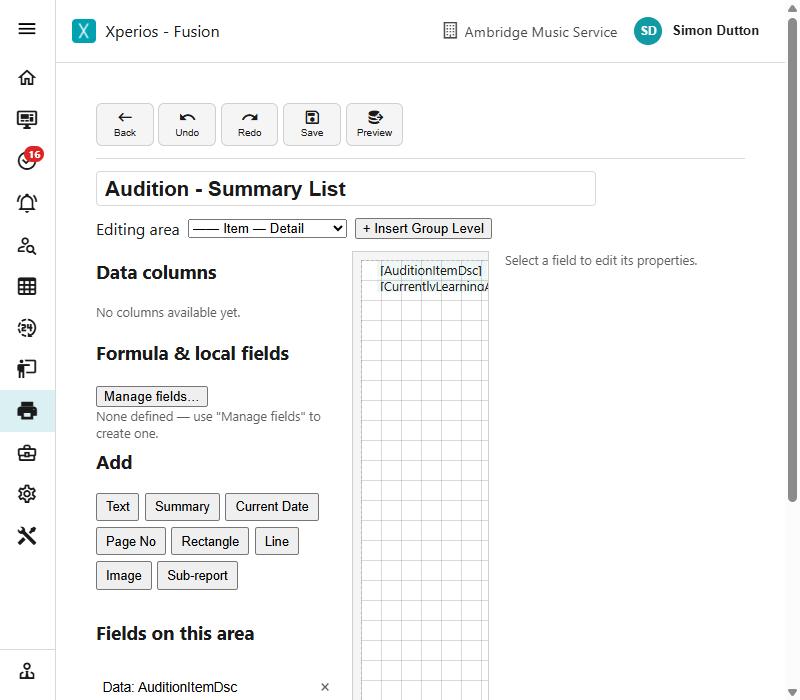
Where a report has to look right on paper — a letter per school, a pay claim per teacher, anything with a letterhead and page numbers — build it in the Report Designer rather than saving a query view.
Reports are made by Paritor, not on your own database
Like queries, reports are maintained centrally while the features are still changing, so on your database there is no Save as Report and no New Report Design. This page describes how the reports you are given were built. If the report you need does not exist, ask us for it — it is then made once and every customer gets it.
Start from New Report Design. A designed report is built visually as a set of bands, with each piece of content placed and sized inside one.
Page setup
The page itself has a size, an orientation — portrait or landscape — and margins. Set these first: they decide how much room the bands have.
Bands
Page header and footer — repeat on every physical page. This is where a title, logo, "week commencing" line, or page numbers go.
Report header and footer — appear once, at the very start and very end, rather than on every page.
Root band — the main body, one row per record.
Groups — a report can group its rows by a column, each group with its own header and footer. A group header might carry the teacher's name and address; a group footer a totals line for that teacher.
Groups nest. A report can group by Teacher, then by Contract inside each teacher's section, then list the individual sessions inside each contract. Group headers repeat automatically when a group runs over a page break.
What you can place in a band
| Data | A column from the query |
| Text | A fixed label |
| Summary | A total, average, count, minimum or maximum |
| Formula | A value calculated per row |
| Local | A value calculated once for the whole run |
| Special | Page number, "page N of M", or the current date |
| Image | A logo or picture |
| Chart | A chart |
| Line, Rectangle | Rules and boxes for structure |
| Sub-report | Another whole report, embedded |
Summary fields
A summary is scoped to the band it sits in. The same Sum placed in the root band gives a whole-report total; placed in a group footer, it gives the total for just that group. Available as Sum, Average, Count, Min and Max.
Formula fields and local fields
Both are small calculations written as an expression, and the difference is how often each is worked out.
Formula fields are calculated once per row — converting minutes to hours for each session, say. Use one anywhere a data field can go.
Local fields are calculated once per report run — a title line, or the date the report was produced.
If the value changes from row to row it is a formula field; if it is the same everywhere on the report, it is a local field.
Sub-reports
A sub-report embeds another whole report inside a band, run once for each row of the parent — one audition's items listed under each audition, for example.
You choose which report to embed and map the parent's values onto its parameters, so each copy runs for the right record.
Unlike everything else on the canvas, a sub-report has no fixed height: it is however many rows tall it needs to be. The designer shows it at the size you drew it as a placement guide, but the finished report lets it grow.
Seeing the result
Running a designed report opens it in the Report Viewer, where it is paginated, printable, and exportable.
Working on several items at once
Hold Ctrl to add an item to the selection, or Shift to take a run of them, then move or change the lot together.
| Copy / Paste | Duplicate what you have selected, within the report or into another |
| Hide / Show | Take an item off the design without deleting it, and bring it back |
| Size to Fit | Shrink a section to the items actually in it, closing up the empty space below |
Hide is the one worth knowing: it is how you keep a column you may want again without having to rebuild it, and how you try a layout without losing the old one.