
Appearance
Adding and arranging content
Adding a tile
From a dashboard, + Add Part opens a picker of existing Dashboard Items and drops the chosen one onto the canvas as a new tile.
INFO
You choose from the Dashboard Items Paritor has made — you cannot build a new one on your own database at the moment. If the figure or chart you want is not in the picker, ask us for it.
Arranging the canvas
Tiles can be dragged and resized freely on the grid. Changes save automatically, and tiles can be removed individually.
Refreshing
Each tile has its own manual refresh button and an optional auto-refresh interval: off, 30 seconds, 1 minute, 5 minutes, or 15 minutes. A Refresh All button refreshes the whole dashboard at once.
Outside of that, tile data is static until refreshed — it does not update continuously by itself.
A dashboard you come back to within about five minutes shows what it showed before rather than running everything again, which is what makes flicking between dashboards quick.
How a tile looks
A tile is a plain card with its name as a small caption above it, and nothing else in the way of the figures. A tile showing one number has no caption at all: the number, with its name under it.
Its buttons — refresh interval, settings, refresh, switching between the data and the chart, and remove — sit at the top right, and appear when you hover over the tile or move the keyboard onto it. On a touchscreen, where there is no hovering, they are simply always there.
If your tiles look shorter than they used to
They are, by about a fifth. The grid's rows were made shorter so a dashboard fits more without scrolling, and a figure with a breakdown under it puts the figure at the top and grows by one row for each line of the breakdown. A chart with only one thing to show — one service type, say — now fills its tile instead of drawing a single lonely bar in the corner.
Ready-made measures
Xperios supplies a set of tiles for the numbers most services watch, so a useful dashboard can be built without writing a query.
| Places in Tuition | How many pupils are being taught |
| New Starters | Pupils who started, this year or this term |
| Leavers | Pupils who left, this year or this term, and why |
| Net Invoiced | What you have invoiced, this year or this month |
| Pupils Taught | How many pupils were actually taught in a week, Direct and Indirect |
Each comes as a stat tile showing the figure, and as bar charts breaking it down — places by area, instrument, venue type and service type; starters and leavers by month; invoiced by month and service type.
The Progression dashboard
A ready-made dashboard of its own, for how far pupils move up the assessment levels: average progress and the percentage who moved up, this year and last, then nine breakdowns comparing last year with the year before. The Tuition dashboard carries two more, Places in Tuition by Assessment Level and Pupils Not Yet Assessed.
What the figures mean, and the values they depend on, are on Assessment levels and progress — worth reading before quoting any of them, because they rest on a number against each level that your service can change.
Pupils Taught
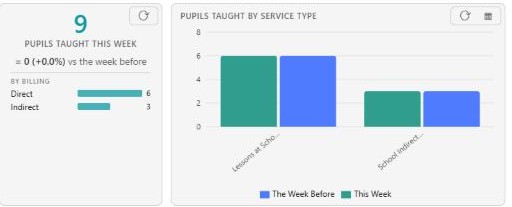
Pupils Taught This Week counts everybody taught in the seven days to today, split Direct and Indirect and set against the week before. Pupils Taught by Service Type breaks that same week down.
Why it is bigger than Places in Tuition
Xperios holds a plan's pupils in two ways, and services use both. Some name every pupil as a tuition record, even for indirect lessons. Others put only a number on the plan year, which is how curriculum classes are usually kept.
This measure takes the higher of the two for each plan, so neither way is missed and neither is counted twice. Places in Tuition counts named places only — so where classes are kept as a number, the two figures are legitimately far apart. At one service the gap is about 4,900 curriculum pupils.
If somebody asks why the dashboard shows two different pupil counts, that is the answer: they are counting different things, and both are right.
Two things it is not
Not distinct children. A class held as a number cannot tell one child from another, so a pupil in two counted classes is counted twice. It is pupils taught, not children taught.
Not a steady weekly figure. Taught that week counts only plans with a lesson in those seven days, so it dips in a holiday or an inset week — nothing has gone wrong. Where you want a figure that does not move with the timetable, use On the books instead.
Asking it yourself
The query behind the tiles is KPI - Pupils Taught, and it takes:
| Measure | Taught that week, or On the books |
| As at | The day the week ends |
| Compare with | The week before, the same week last year, or nothing |
| Break down by | Billing, service type, area, venue, venue type, instrument or activity group |
| Billing | Narrow it to Direct or Indirect |
Comparison
A stat tile can show how the figure compares with the same period last year:
▲ 39 (+4.4%) vs same period last year
Set Compare with when you save the tile, and tick Higher is better so the movement is coloured correctly — more starters is good news, more leavers is not.
These are a starting point
Add the ones you want and arrange them. If you need a different period or breakdown, ask us and we will add it for everyone.