Appearance
Dashboards
A Dashboard is a personal, at-a-glance screen made up of live tiles — numbers, charts, or tables — arranged on a grid.
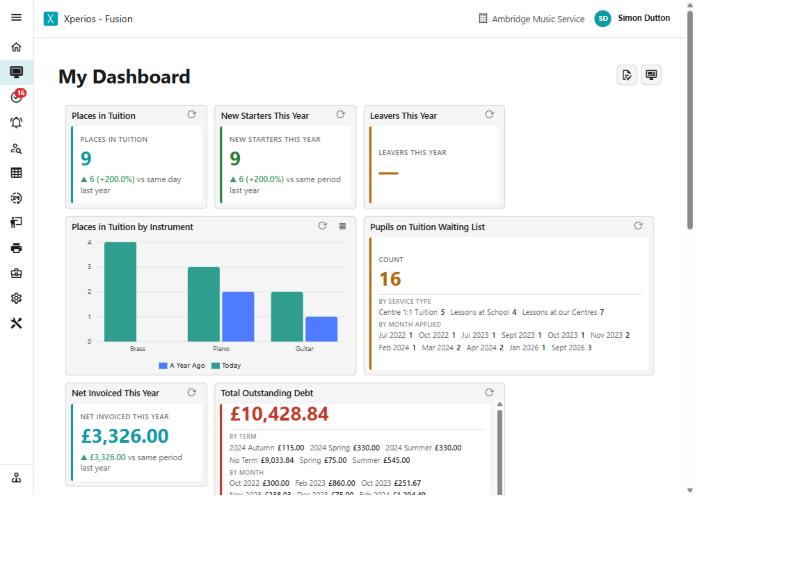
Unlike a Report, which is a formatted document you would print or email, a Dashboard is something you keep open and glance at.
The three parts
Dashboard Item — a saved, reusable snapshot of a Query's results: its chosen columns, its view (a plain table, a grouped or summarised table, a pivot table, or a chart), and fixed values for any parameters. Paritor makes these and they come with Xperios; you choose which to put on your dashboards.
Unlike a Report, a Dashboard Item's parameter values are locked in when you save it. It is not re-prompted each time, so it can sit there and update quietly.
Dashboard — the page or canvas itself. It does not hold any data directly.
Dashboard Part — the link between the two: one Dashboard Item, placed at a specific position and size on a specific Dashboard. The same saved Dashboard Item can be placed on more than one dashboard.
Dashboard Items are made by Paritor, not on your own database
Like queries, Dashboard Items and dashboards are maintained centrally while the features are still changing, so on your database there is no Save as Dashboard Item and no + New Dashboard. You choose from the ready-made items and add them to your dashboards. If the figure or chart you want is not there, ask us for it — it is then made once and every customer gets it.
In this section
Starting from nothing
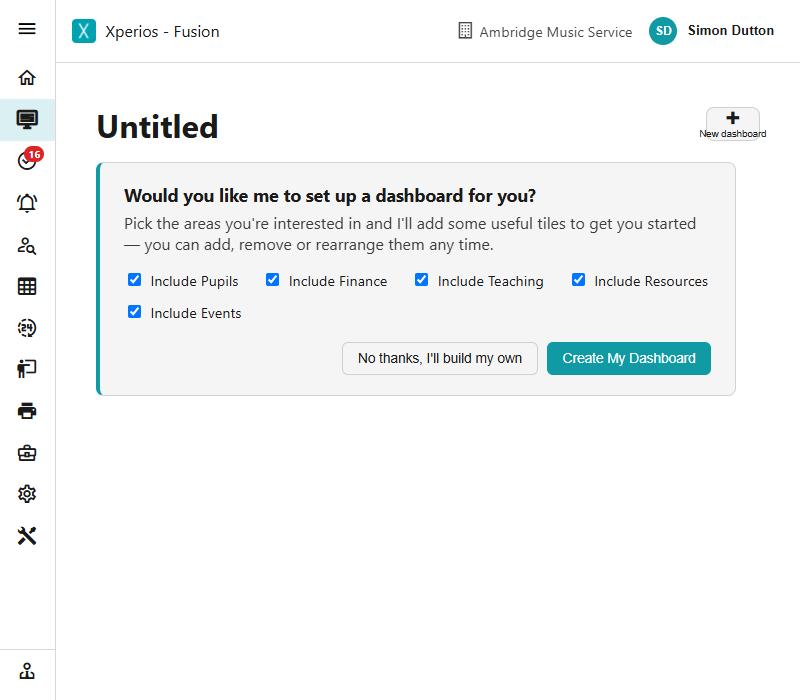
The first time you open Dashboards there is nothing to show, so Xperios offers to build one for you. Pick the areas you care about and it adds a set of useful tiles to start from — all of which you can change, move or remove afterwards.